

Net revenue retention (NRR) is the share of recurring revenue you still collect from an existing group of customers after a set period, usually 12 months, once expansion, downgrades and cancellations are counted. A result above 100% means the customers you already had are paying you more than they did a year ago, even before any new logo is signed. For founders planning a sale, NRR is often the first retention number a buyer asks for, and the one they recalculate most carefully. This guide explains the formula, how NRR differs from gross revenue retention, what counts as a good figure, and how buyers turn it into price and terms for 2027 deals.
Key Takeaways
- NRR compares this year’s recurring revenue from a fixed customer cohort with the same cohort’s revenue 12 months earlier. New customers signed during the period are excluded.
- Gross revenue retention (GRR) uses the same cohort but ignores expansion, so it can never exceed 100%. Buyers read the two together because strong upsell can hide heavy churn.
- Recent survey data from SaaS Capital puts the median NRR for bootstrapped SaaS companies with $3M to $20M of ARR at about 103%, with the 90th percentile near 118%.
- Buyers rebuild NRR from customer-level billing data. Reactivations, new subsidiaries booked as upsell, one-off usage spikes and short measurement windows are the usual reasons their number is lower than the seller’s.
- Retention compounds. Two companies with the same ARR today can look very different in three years, which is why NRR affects the growth case, the buyer universe and how much of the price is paid at closing.
What Is Net Revenue Retention?
NRR answers one narrow question: if you stopped selling to new customers today, would the revenue from your current customers grow, hold or shrink over the next year? It is measured on recurring revenue only (MRR or ARR) and on a cohort that is fixed at the start of the period. Anyone who became a customer after that date is left out, even if they are now your largest account.
Three movements change the cohort’s revenue during the period:
- Expansion: upsells to a higher plan, extra seats, added modules, usage growth and price increases on renewal.
- Contraction: downgrades, fewer seats, discounts granted to keep a customer, and lower usage.
- Churn: revenue lost when a customer cancels or does not renew.
Because expansion can outweigh losses, NRR is one of the few SaaS metrics that can sit above 100%. It also goes by other names. Net dollar retention (NDR) and net retention rate are used for the same calculation in most investor decks and public filings, and the label matters far less than the definition behind it. If you want a refresher on how recurring revenue works in the first place, see our guide to how the SaaS business model works.
What does NRR stand for in a sale process?
In a sale process, NRR stands for net revenue retention, and the buyer will expect it to be defined in writing. Data rooms that list a single headline figure with no cohort, period or revenue basis tend to generate more diligence questions, not fewer. A clear definition, applied the same way every quarter, is part of what makes the number believable.
Net Revenue Retention Formula and How to Calculate It
The standard net revenue retention formula uses the starting recurring revenue of one cohort and the three movements above:
NRR = (Starting ARR + Expansion − Contraction − Churn) ÷ Starting ARR × 100
The cohort version gives the same answer in a different way: take the ARR you bill today to customers who were active 12 months ago, and divide it by what those same customers paid 12 months ago. Billing analytics tools usually compute the movement version because it can be built from monthly changes, but buyers often check it against the cohort snapshot to make sure nothing has been double counted.
A step-by-step example
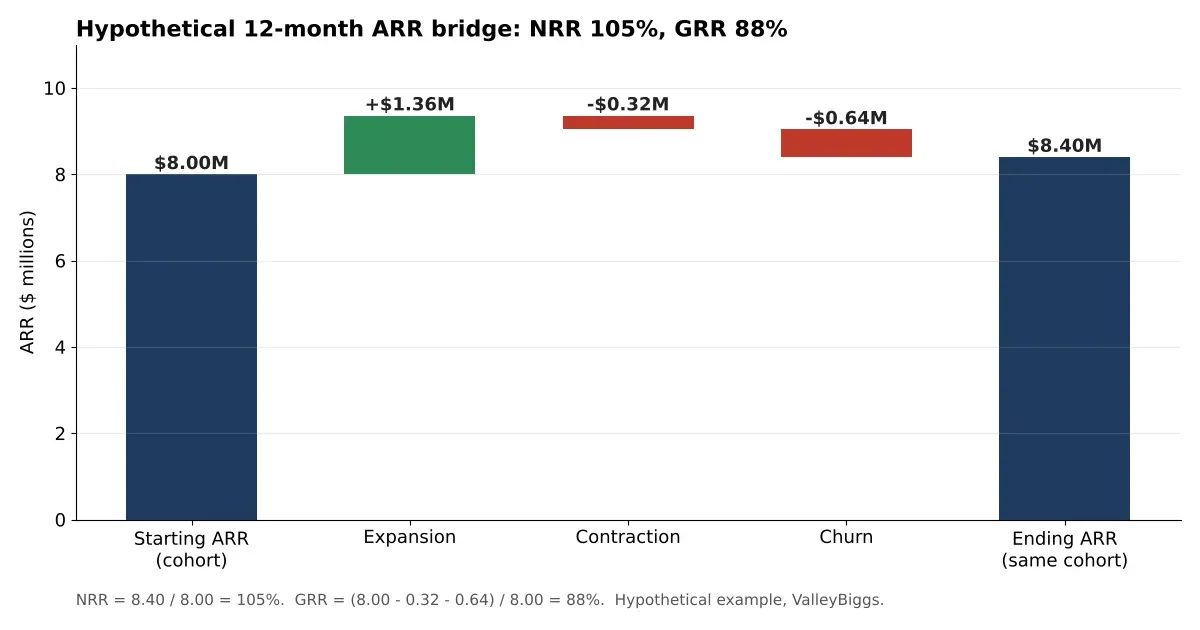
Here is how to calculate net revenue retention for a hypothetical B2B software company with $8.0M of ARR from the customers it had on January 1:
- Fix the cohort: every customer billing on January 1, with $8.0M of combined ARR.
- Add expansion from that cohort over the next 12 months: $1.36M from seats, add-ons and renewal price increases.
- Subtract contraction: $0.32M from downgrades and seat reductions.
- Subtract churn: $0.64M from customers who cancelled or did not renew.
- Divide the ending figure, $8.40M, by the starting $8.0M. NRR is 105%.
Monthly vs annual measurement
You can measure NRR monthly, quarterly or annually, but compare like with like. A monthly figure of 101% is not the same as an annual figure of 101%, and annualizing a single strong quarter is one of the quickest ways to lose a buyer’s trust. Most acquirers ask for a trailing 12-month calculation, shown quarter by quarter for at least two years, so they can see the trend rather than a single point.
NRR vs GRR: Why Buyers Look at Both
Gross revenue retention uses the same cohort and the same period but leaves expansion out. Using the example above, GRR is ($8.0M − $0.32M − $0.64M) ÷ $8.0M, or 88%. NRR can never be lower than GRR, and the gap between them shows how much of your retention story depends on selling more to the customers who stay.
| Net revenue retention (NRR) | Gross revenue retention (GRR) | |
|---|---|---|
| Counts expansion | Yes | No |
| Can exceed 100% | Yes | No, 100% is the ceiling |
| Main question it answers | Is revenue from existing customers growing? | How much revenue would you keep with no upsell at all? |
| What a buyer reads into it | Growth efficiency and pricing power | Product stickiness and downside risk |
| Typical warning sign | High NRR driven by a few large accounts | GRR well below peers for your price point |
A company can report 115% NRR while losing a fifth of its starting revenue to churn each year, as long as a handful of large customers expand quickly. Buyers treat that profile differently from one with 108% NRR and 95% GRR, because the second business keeps its base even if expansion slows. When you present retention, show NRR vs GRR side by side and explain the gap.
What Is a Good Net Revenue Retention Rate?
There is no single target. What counts as good depends on your customer type, price point, contract length and stage. The ranges below come from published benchmark studies, and each uses a different sample, so treat them as reference points rather than a pass or fail line.
| Benchmark (source) | Median NRR | Upper range | Notes |
|---|---|---|---|
| Bootstrapped SaaS, $3M to $20M ARR (SaaS Capital, 2026 survey) | About 103% | About 118% at the 90th percentile | Median GRR for the same group was about 91% |
| Private SaaS with $25K to $50K ACV (SaaS Capital, 2025 survey) | About 102% | About 111% at the top quartile | Bottom quartile reported about 97% |
| B2B SaaS, broad sample of about 3,500 software companies (ChartMogul, December 2025) | About 82% | About 97% at the top quartile | Sample includes many small, low-price products; consumer and AI-native products were lower |
The gap between those studies is mostly about who is in the sample. Surveys of companies above $1M to $3M of ARR, with business customers and annual contracts, report medians above 100%. Broad samples that include low-priced monthly products report much lower figures. In practice, buyers compare you with companies that sell to a similar customer at a similar price, so benchmark against the closest group you can find.
As a rough reading for a B2B software company preparing to sell:
- Above 110%: expansion is a real growth engine. Expect buyers to ask how concentrated it is and whether it repeats every year.
- 100% to 110%: a healthy base that grows on its own. Most buyers will focus on GRR and on the trend.
- 90% to 100%: new sales are carrying growth. Buyers will want to know why customers leave or shrink, and whether that is fixable.
- Below 90%: retention will be a central diligence topic, and it often changes the deal structure more than the headline price.
How Buyers Recalculate Your NRR in Diligence
Few buyers accept a retention figure from a board deck. Their finance team or outside accountants usually rebuild it from invoice-level or subscription-level data, often as part of a quality of earnings review alongside adjusted EBITDA and its add-backs. The rebuilt number is the one that ends up in their model.
Common adjustments
| Item in the seller’s figure | How buyers often treat it | Hypothetical effect |
|---|---|---|
| Seller-reported NRR, best recent quarter annualized | Replaced with a trailing 12-month cohort calculation | 116% before adjustments |
| New subsidiaries or new divisions of existing customers booked as expansion | Reclassified as new business and removed from the cohort | −4 points |
| Reactivated customers who had churned before the period | Excluded or shown separately | −2 points |
| One-time usage overages or implementation fees | Removed from recurring revenue | −3 points |
| Contracted price increases not yet billed | Removed until they are live | −2 points |
| Rebuilt NRR used in the buyer’s model | 105% |
The adjustments in this table are illustrative, not typical values, but the pattern is common: the further the reported figure is from a clean, billed, trailing 12-month calculation, the larger the gap. Public companies face the same discipline. SEC guidance on key performance indicators, issued in 2020, expects companies that disclose metrics such as retention to define them clearly and explain any change in how they are calculated. Private buyers apply a similar standard in practice.
What buyers ask for
- A customer-level revenue file by month for at least 24 to 36 months, with a stable customer ID.
- NRR and GRR by cohort year, by customer segment (enterprise, mid-market, SMB) and by product line.
- The share of expansion that came from your top 10 customers.
- A reconciliation from the retention data to recognized revenue in the financial statements.
- Renewal dates, notice periods and any customer who has asked for a discount or a downgrade.
Preparing this before you go to market shortens diligence and keeps the conversation on your growth plan. The same data also supports a credible LTV:CAC ratio, since both metrics depend on the same churn and expansion inputs.
How Net Revenue Retention Affects Valuation
Software companies are often priced on a multiple of ARR or revenue, and retention is one of the main reasons two companies of similar size receive different multiples. SaaS Capital, for example, builds its predicted valuation multiples for private SaaS companies from growth and NRR data. The reasoning is simple: a buyer is paying for future revenue, and NRR tells them how much of today’s revenue is likely to still be there, and how much bigger it will be, without any new sales.
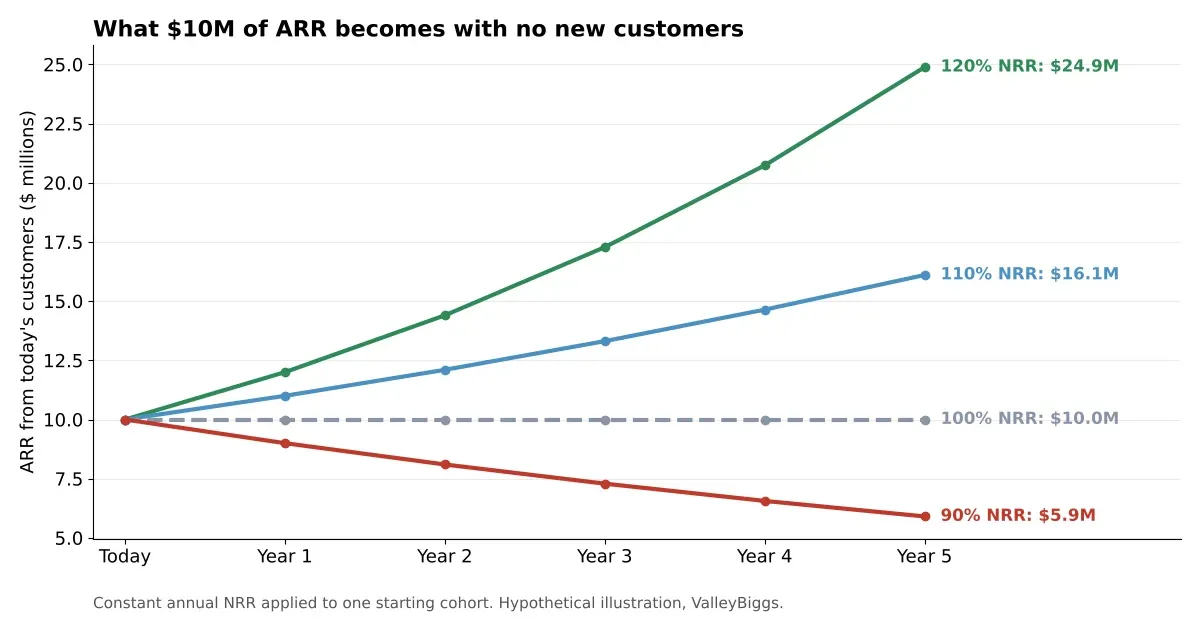
In the hypothetical chart above, a company with $10M of ARR and 90% NRR has about $7.3M left from those customers after three years. At 110% NRR the same base grows to about $13.3M. That difference flows into a buyer’s model in several ways:
- Growth case: higher NRR means less of the forecast depends on new sales, so buyers are more willing to pay for that forecast.
- Buyer universe: strategic acquirers and growth-focused private equity funds tend to screen for retention first. Weak NRR narrows the field, often to buyers who price in a turnaround.
- Efficiency metrics: NRR feeds directly into growth rate and the Rule of 40, which many software investors use to compare companies of different sizes.
- Deal structure: when retention is uncertain, buyers often shift part of the price into an earnout or holdback tied to revenue after closing, which is usually set out in the letter of intent.
We do not publish rule-of-thumb multiples for each NRR band, because the multiple also depends on growth, margins, size, market and the buyer. An independent valuation analysis is the more reliable way to see what your retention is worth in today’s market.
NRR for eCommerce Subscriptions and Usage-Based Models
NRR was built for subscription software, but buyers apply it to other recurring models with a few changes:
- Usage-based pricing: NRR can run high when customers grow, and fall quickly when they cut usage. Buyers look at volatility by quarter and at the largest accounts, not just the annual figure.
- Subscription ecommerce and memberships: customer counts are high and order values are low, so buyers often focus on cohort revenue curves and gross retention rather than expansion.
- Hybrid models with services: implementation and consulting revenue is usually removed before retention is measured.
If your business sits between software and ecommerce, define which revenue counts as recurring before you share any retention figures. Our page on selling a SaaS business covers how buyers treat mixed revenue in more detail.
Red Flags Buyers Notice in Retention Data
- NRR above 110% with GRR below about 85%, which suggests that a few accounts are masking widespread churn.
- A large share of expansion coming from one or two customers, or from a single price increase.
- Retention that improves only in the quarters just before the sale process starts.
- Different definitions of NRR in the board deck, the confidential information memorandum and the data room.
- Retention data that cannot be reconciled to recognized revenue, or customers whose IDs change after upgrades.
- Rising discounts at renewal, which show up as contraction a year later.
How to Improve NRR Before a Sale
Because buyers look at the trend over two to three years, the best time to work on retention is well before you hire an advisor. Practical steps that tend to show up in the numbers:
- Set one written NRR and GRR definition and recalculate past periods the same way, so the history is consistent.
- Segment retention by customer size, acquisition channel and product to find where churn actually comes from.
- Fix involuntary churn first: failed payments, expired cards and missed renewal notices are usually the cheapest losses to recover.
- Move more customers to annual or multi-year terms where it suits them, which reduces the number of decision points each year.
- Build an expansion path that does not rely on discounts: usage tiers, added modules or seat-based pricing.
- Review pricing and retire legacy plans so that renewals reflect current list prices.
Avoid changes made only to lift a headline number. Buyers compare cohorts over time, and a sudden jump without an operational reason usually invites more scrutiny.
Preparation Checklist for Your Data Room
| Item | Why buyers want it | When to prepare it |
|---|---|---|
| Written NRR and GRR definitions | Shows the figures are consistent and repeatable | 12 to 24 months before a sale |
| Customer-level monthly revenue file | Lets buyers rebuild NRR and GRR themselves | Before marketing begins |
| Cohort tables by start year | Shows whether newer customers behave like older ones | Before marketing begins |
| Expansion concentration analysis | Shows how much growth depends on a few accounts | Before marketing begins |
| Reconciliation to financial statements | Ties operating metrics to audited or reviewed numbers | Before diligence |
| Renewal and churn risk list | Avoids surprises after the letter of intent | Before diligence |
When to Talk to an M&A Advisor
If you expect to sell within the next one to three years, an early review of your retention data is useful even before you decide on timing. An advisor can rebuild NRR and GRR the way a buyer would, compare them with relevant peers, and show how they are likely to affect value and structure. ValleyBiggs works with founders of software and technology companies through SaaS M&A advisory, from preparing metrics to running a competitive process.
Conclusion
Net revenue retention tells a buyer how much your existing customers are worth next year, and the year after that. Calculate it on a fixed cohort, on billed recurring revenue, over a trailing 12 months, and show it next to gross revenue retention with a clear bridge between the two. If the number holds up when a buyer rebuilds it, it supports a stronger growth case, a wider set of buyers and more of the price paid at closing. To review your metrics and what they suggest about value, contact ValleyBiggs for a confidential conversation.
FAQs
1. What is net retention vs gross retention?
Net retention counts expansion, downgrades and churn from an existing customer cohort, so it can exceed 100%. Gross retention counts only downgrades and churn, so 100% is its ceiling. Net retention shows whether revenue from current customers is growing, while gross retention shows how much of the base you keep if no customer buys more. Buyers usually ask for both, measured on the same cohort and period.
2. What does NRR stand for and what does it measure?
NRR stands for net revenue retention. It measures the recurring revenue you collect today from customers who were already paying at the start of a period, usually 12 months ago, as a percentage of what they paid then. Revenue from customers signed during the period is excluded, which is why NRR isolates the health of your existing base.
3. Is net revenue retention the same as net dollar retention?
In most cases, yes. Net dollar retention (NDR), net revenue retention and net retention rate describe the same calculation, and companies choose the label they prefer. What matters in a sale is the definition behind it: the cohort, the period, whether reactivations count and which revenue is treated as recurring. Put that definition in writing for buyers.
4. Can NRR be higher than 100%?
Yes. NRR exceeds 100% when expansion from existing customers, such as extra seats, add-on modules, usage growth or price increases, is larger than the revenue lost to downgrades and cancellations. A company with NRR above 100% would still grow if it signed no new customers, which is why buyers pay close attention to it alongside gross retention.
5. How often should a SaaS company measure NRR?
Most companies track NRR monthly for internal use and report a trailing 12-month figure each quarter. For a sale, prepare at least two to three years of quarterly trailing 12-month NRR and GRR, calculated the same way throughout. Buyers distrust annualized single quarters, so a consistent history matters more than one strong recent result.
6. What NRR do buyers want to see before an acquisition?
There is no fixed threshold, but for B2B software with annual contracts, buyers generally treat NRR above 100% as healthy and above 110% as a strength, provided gross retention is also solid. Below 90%, retention usually becomes a central diligence topic. A valuation analysis shows how your figure compares with relevant peers.